
Tags
Node.js
Debug
Published
Mar 3, 2023
noBg
noBg
Introduction
Debugging is life and it’s hard. In this workshop, we will be discussing how to debug JavaScript code in VSCode using the debugger.
Getting Started
- Clone this repository
git clone git@github.com:Jkker/vscode-nodejs-debugging.git
# or
git clone https://github.com/Jkker/vscode-nodejs-debugging.git
- Install Dependencies
cd vscode-nodejs-debugging
npm i
What’s in an Error Message
Let’s run our program and see what happens! We can use the
start script we defined in our package.json with npm run start or manually type node src/index.js. 
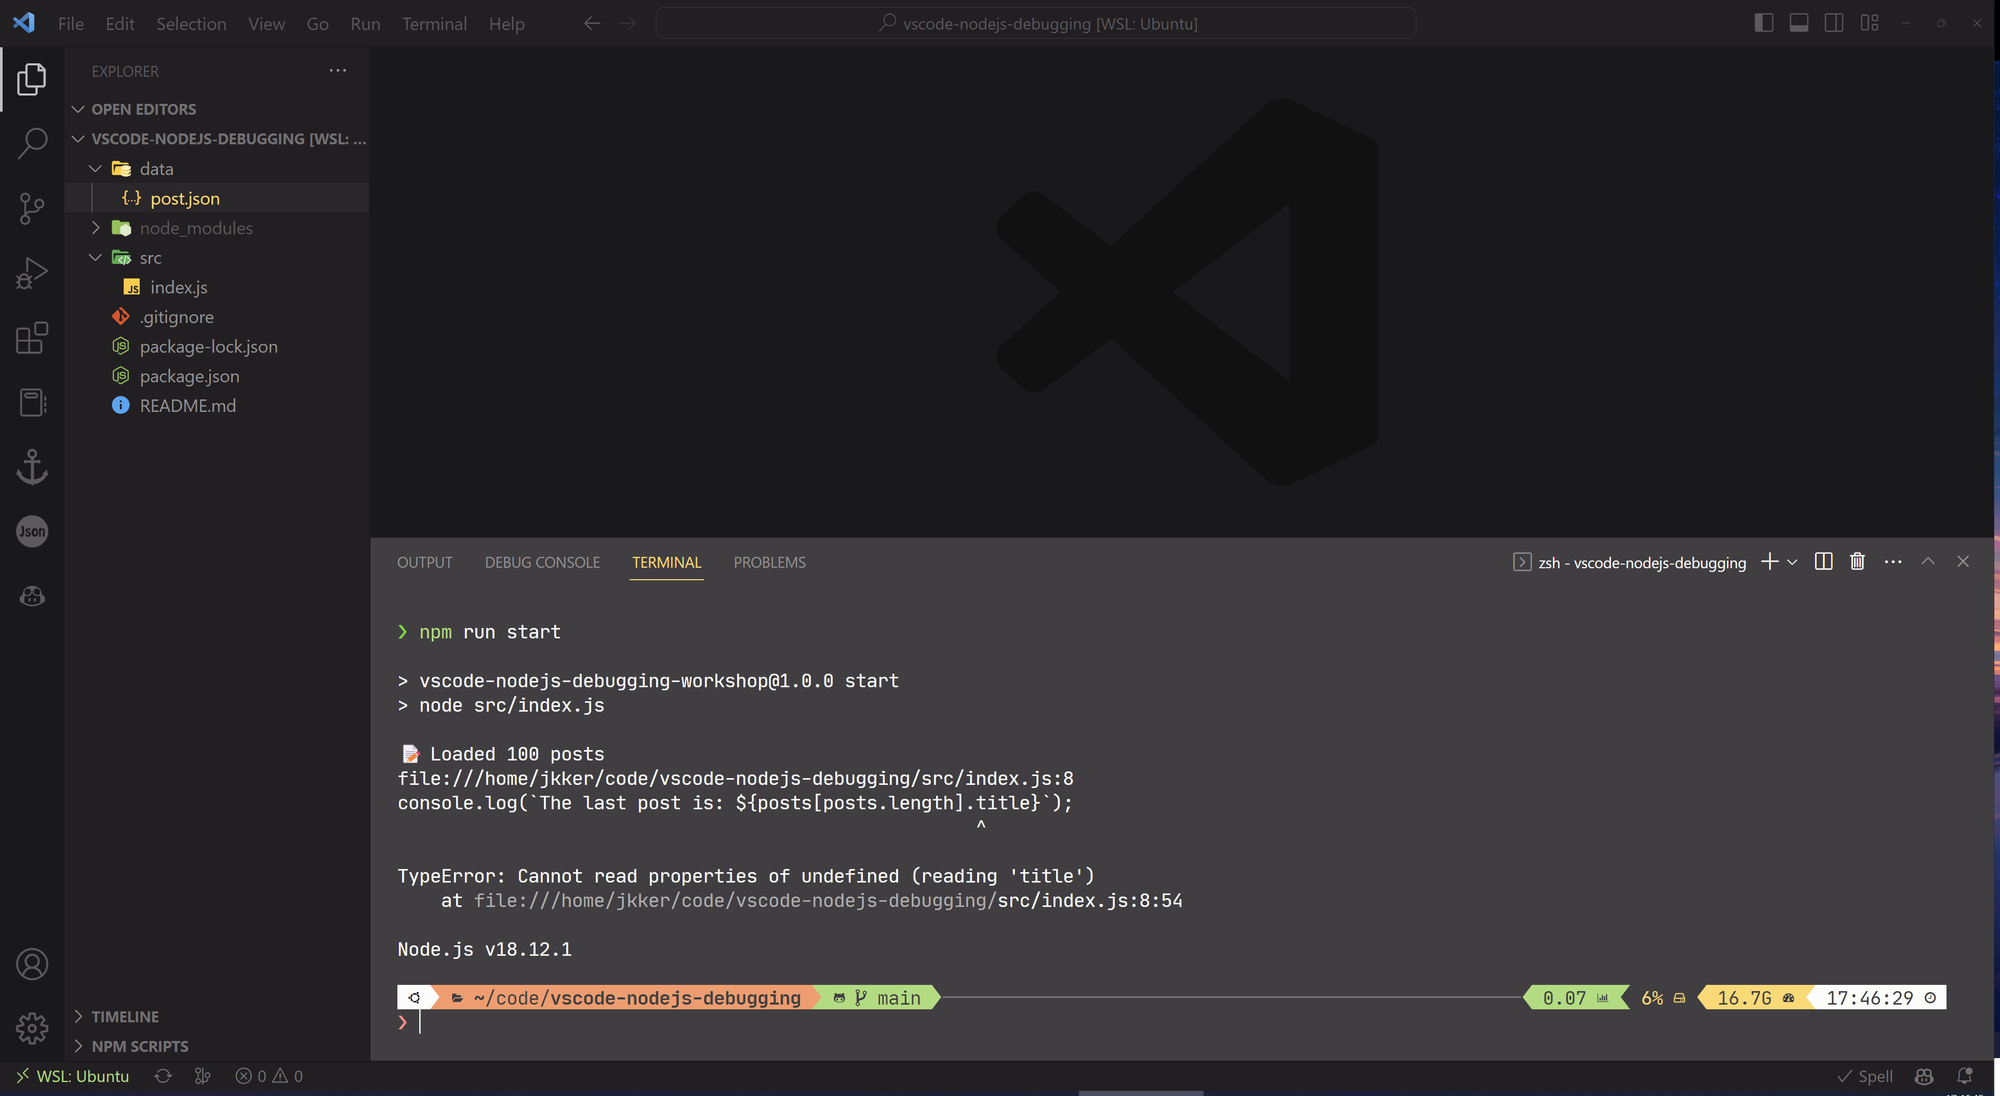
Oops, we got an issue. Luckily, we can locate it by hover on the error path and open it using
ctrl + click.
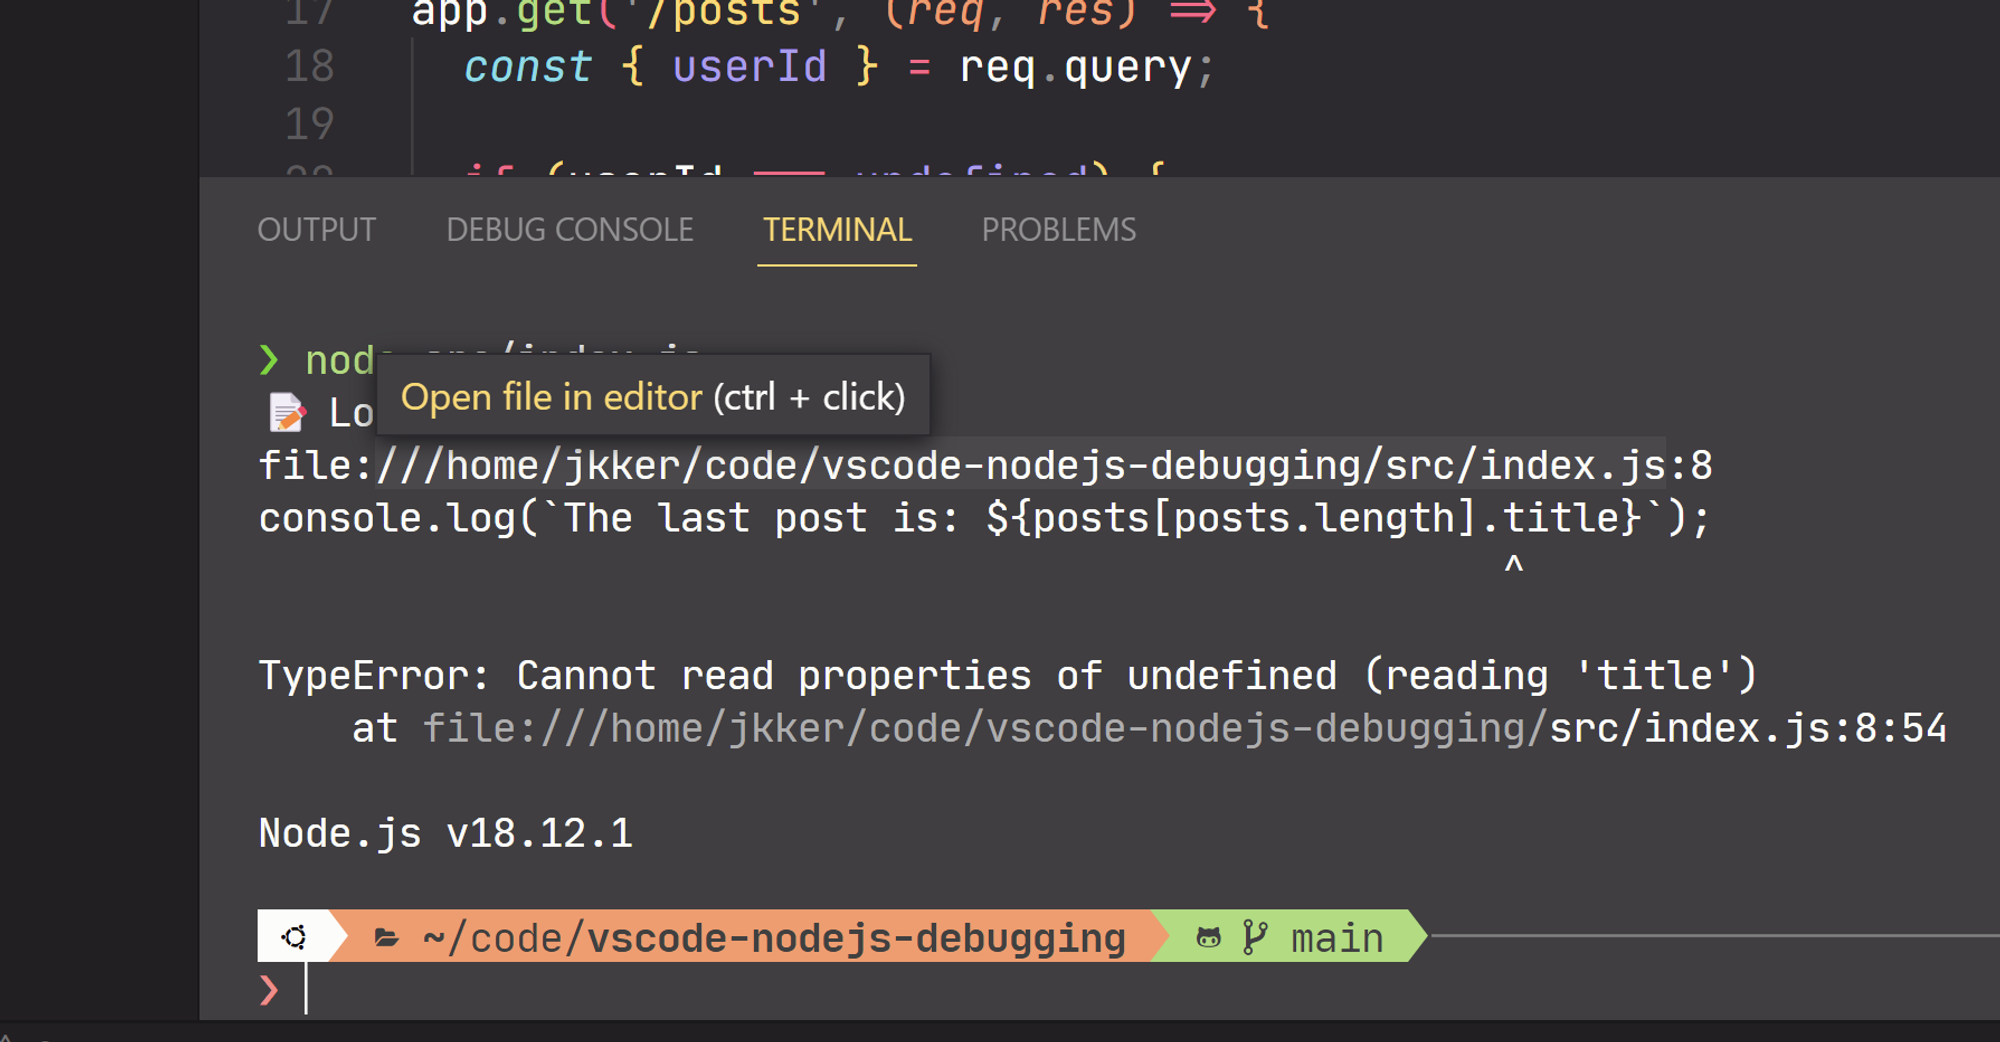
This brings us directly to line 8 where this error occurs.
Let’s take another look at the most important part of our error message:
Cannot read properties of undefined (reading 'title')
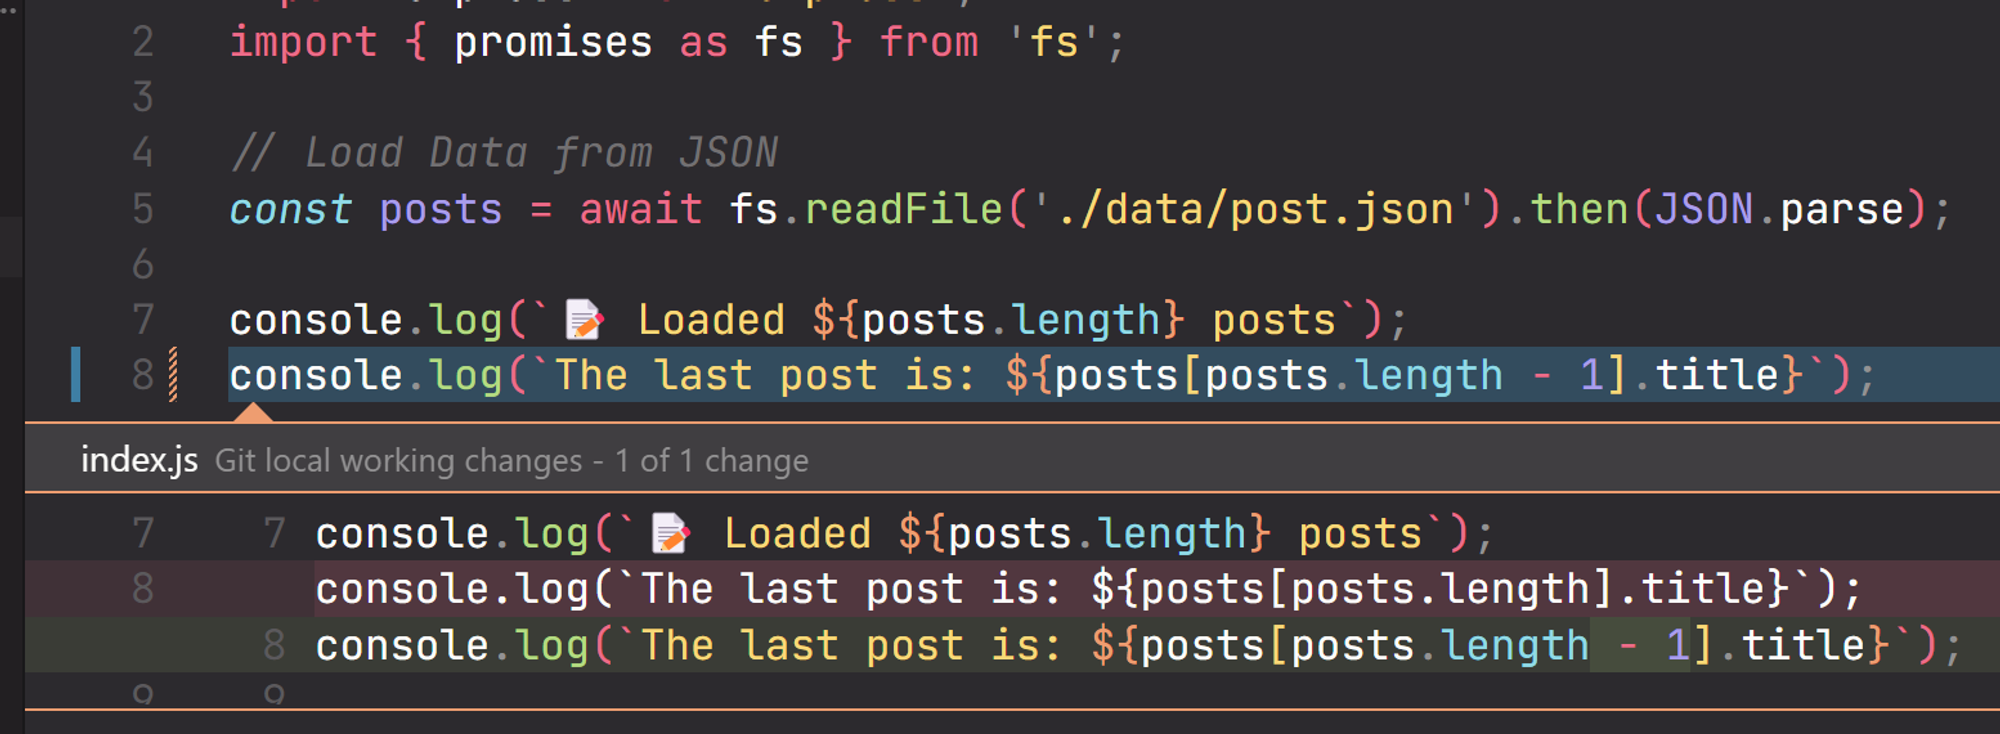
This means that we are accessing the property
title on something that’s undefined.In this case, it’s
posts[posts.length]. Because JavaScript is 0-indexed, this points to somewhere outside this array. So, we should change it to posts[posts.length - 1] or posts.at(-1) to access the last element. 
Run the program again and see if you can help me fix the second error!
⚠️ Spoil Alert
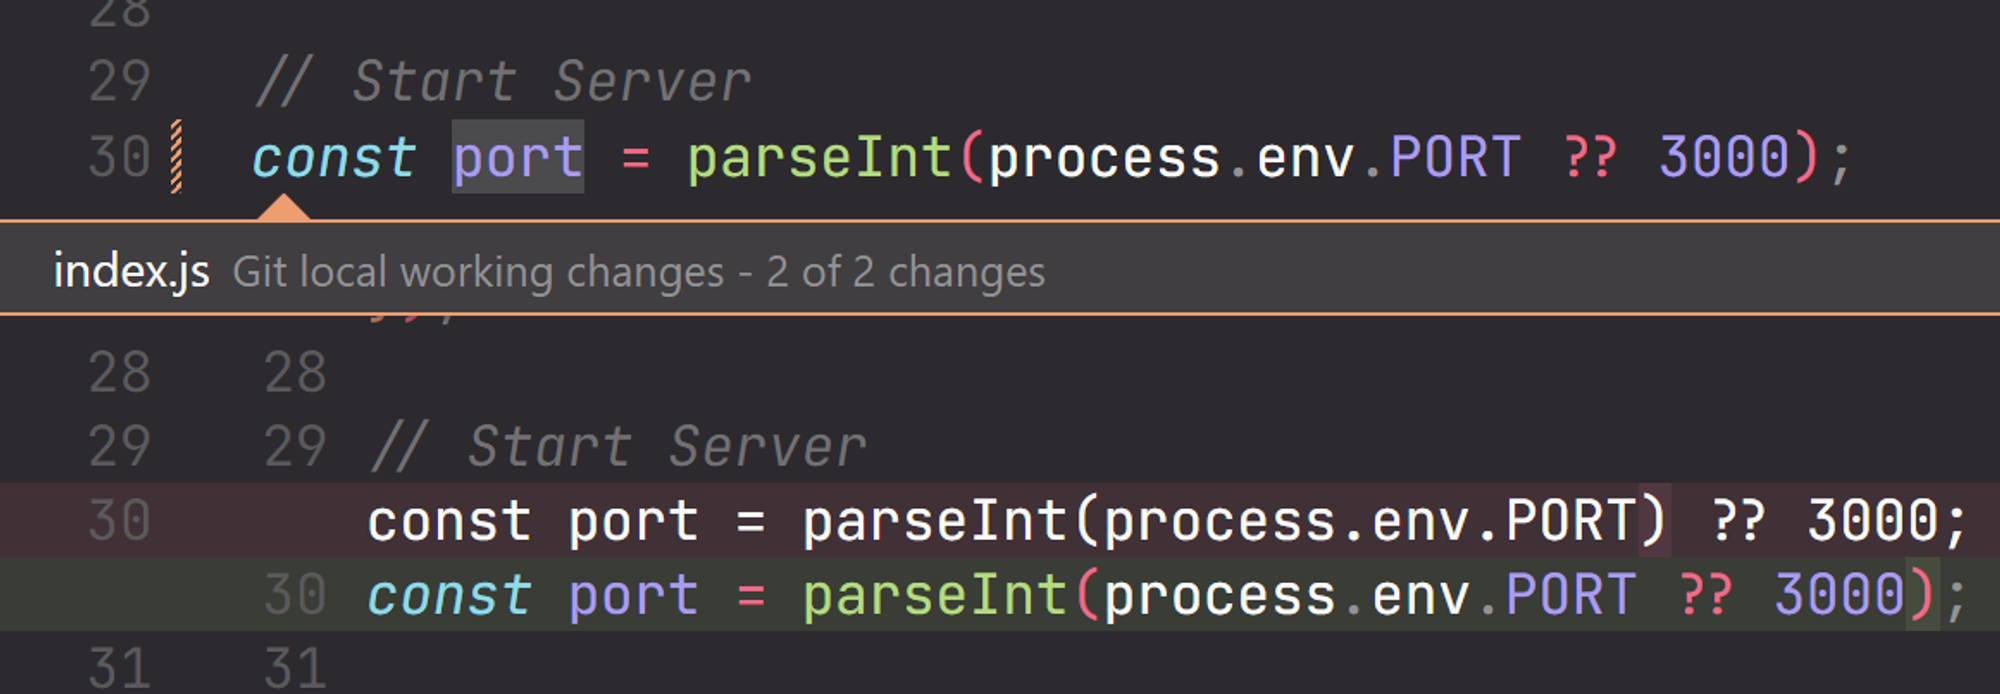
process.env.PORT is undefined, so parseInt(undefined) outputs NaN and causes app.listen() to throw this error. To fix this, we can move
?? 3000 inside parseInt. ?? here is the Nullish coalescing operator. It returns its right-hand side when its left-hand side is null or undefined. 
Once we got those errors fixed, we can finally start our server successfully on port 3000.
We can verify that our app is up and running using curl. However, looks like our
GET /posts route isn’t doing that well: our userId filter doesn’t work. It returns an empty array, though we obviously have some posts from user 1 in our json. 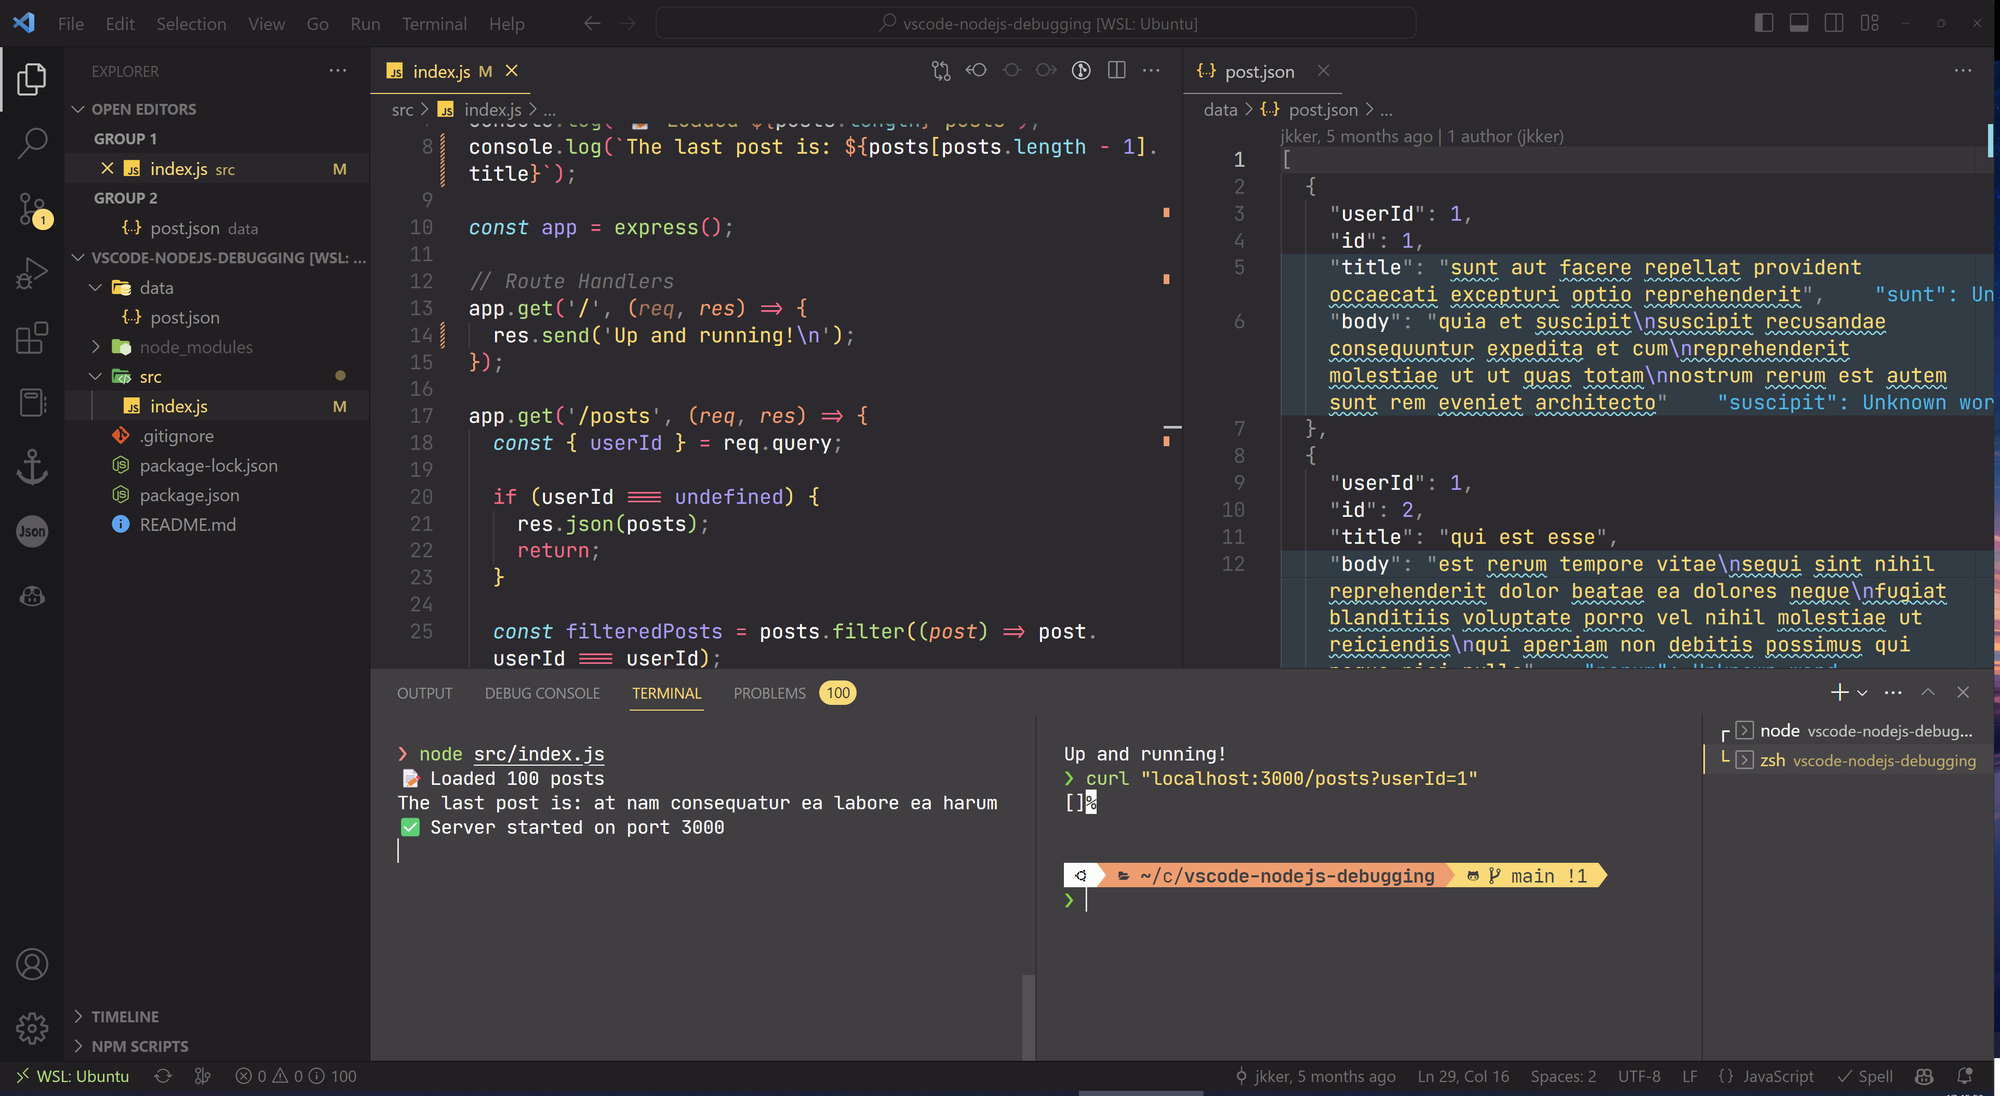
Since we don’t have an error message, it might be hard to find out where this bug occurs. This is one of the reasons why we need a debugger.
Launching the Debugger
- You can open the VSCode Debugger by clicking on the Debug icon in the left sidebar, or by pressing
Ctrl+Shift+Don Windows orCommand+Shift+Don Mac.
- Click
Run and Debug - VS Code will try to automatically detect your debug environment, but if this fails, you will have to choose it manually. In this case, we should select
Node.js. - This will run the currently active file in your editor, so make sure that the entry point of your program (e.g.
index.js) is active, instead of something likelayout.hbs.
- Optionally, you can click on the gear icon open the
launch.jsonconfiguration. This is where you can set environmental variables, command line arguments, working directory, etc. Details can be found here: Launch.json attributes.
Using Breakpoints
Our app is now running normally as if we ran it from our terminal. To find out what happens when we visits
/posts, we should add a breakpoint on line 18 to allow us to inspect the state of our program. Right click on the red dot that appears when you hover on the left-side of the line number to bring up the menu. 
Now, restart our program by clicking on the restart button on the floating toolbar.


Once we’ve sent a request to
posts?userId=1 (via a browser or curl), our debugger pauses our program before it runs line 18. On the left variables panel, we can see that userId is undefined because of this. Navigating the Code
Next, click
Step Over ⤵️ (the 2nd button) on the floating toolbar to move on to the next line of code. 
While our code is running, we can add another breakpoint at line 25 to take a closer look at how the filtering goes. Then, click
Continue▶️ (the first button) to let our debugger move on to the next breakpoint if there’s any. Once we hit line 25, click
Step Into ⬇️ so we can dive into the callback function of posts.filter().Watch Panel & Debug Console
Let’s add those variables that we are interested into the
Watch panel. You can also hover your mouse on them in your code to see their values.
They look different, right? Let’s verify this with the Debug Console.
Everything we run in the debug console are evaluated under the current scope of our running program. In this case, I use the
typeof operator to check these variable’s types. You can also type an expression here or in the Watch panel like userId == post.userId. 
Voilà! Restart the debugger and test it out. Our program should be running as expected now.