
Intro
- Clone Git Repo
https://github.com/Jkker/vscode-nodejs-debugging
- Install Deps
npm i
- Try Running the Program
npm runs start

node src/index.js
Debugger
- Ways to use the debugger
- Open the entry point of your program
- Open the debug panel.
- Click
Run and Debug
- JavaScript Debug Terminal
- Debug Config
env
Getting Started with VSCode Debugger
Installing VSCode
If you don't already have VSCode installed on your machine, you can download it for free from the official website: https://code.visualstudio.com/download
Start Debugging


- Open the VSCode Debugger by clicking on the Debug icon in the left sidebar, or by pressing
Ctrl+Shift+Don Windows orCommand+Shift+Don Mac.
- Click
Run and Debug - VS Code will try to automatically detect your debug environment, but if this fails, you will have to choose it manually. In this case, we should select
Node.js. - This will run the currently active file in your editor, so make sure that the entry point of your program (e.g.
index.js) is active, instead of something likelayout.hbs.
- Optionally, you can click on the gear icon open the
launch.jsonconfiguration. This is where you can set environmental variables, command line arguments, working directory, etc. Details can be found here: Launch.json attributes
Overview of the Debugger Panel

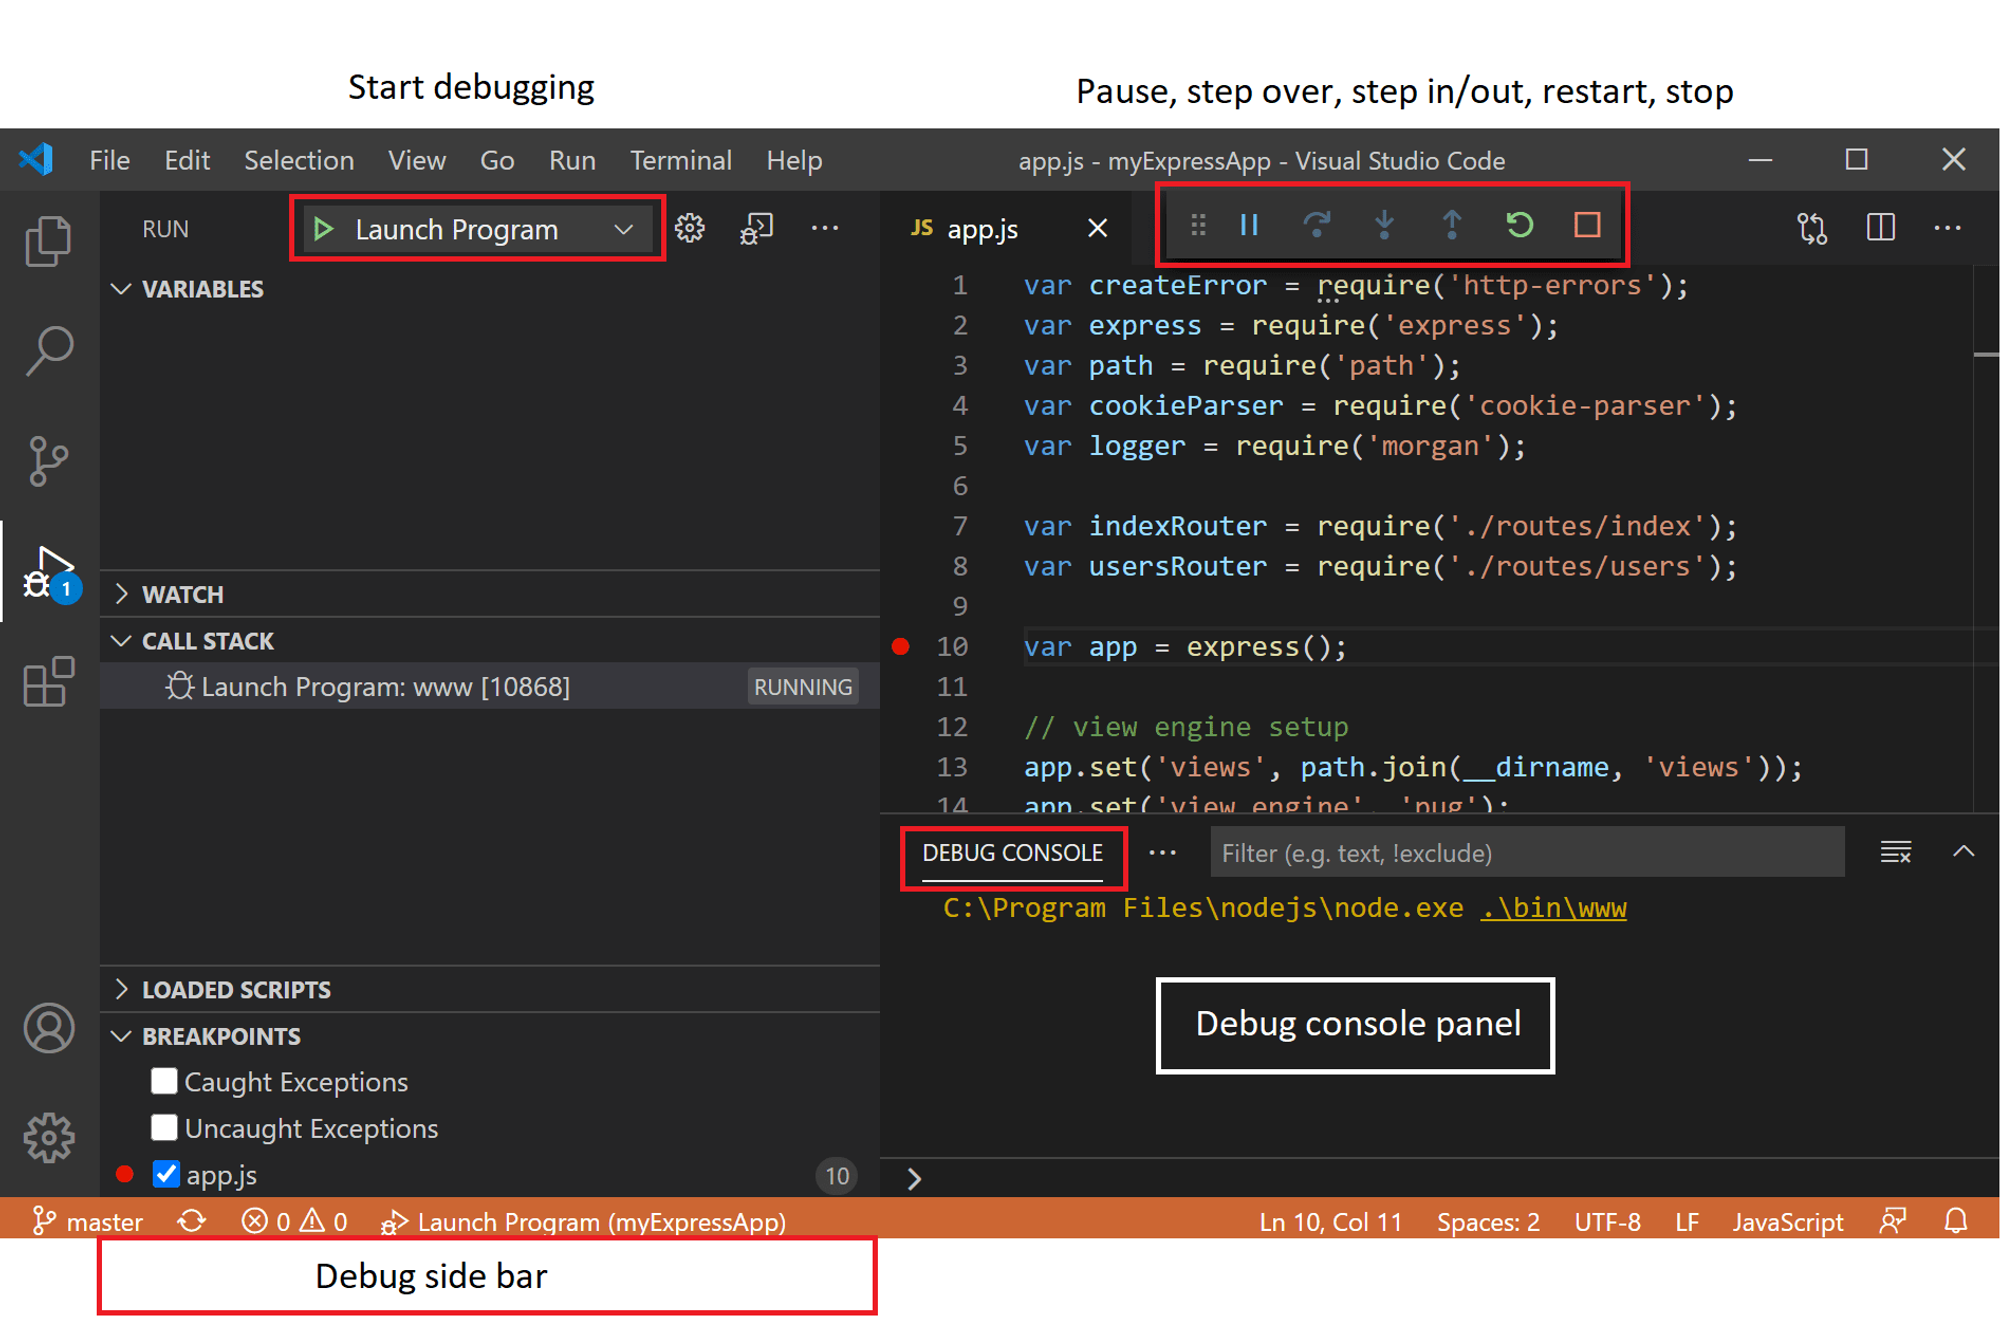
The VSCode Debugger panel is divided into several sections:
- The Variables: Shows the variables that are in the current scope.
- The Watch: Allows you to watch the values of expressions and variables.
- The Call Stack: Shows the function call stack.
- The Breakpoints: Shows the breakpoints that have been set in your code.
Basic Debugging Techniques
Setting Breakpoints
A breakpoint is a point in your code where the debugger will stop and allow you to inspect the state of your program.


- Click on the line number where you want to set a breakpoint. A red dot will appear on the line.
- Run your program in the debugger by pressing
F5or clicking on the green play button in the Debug sidebar.
- The debugger will stop at the breakpoint you set. You can now inspect the state of your program using the Debugger panel.
Using Logpoints
Logpoints allow you to log a message to the console without stopping the debugger.
- Right-click on the line where you want to log a message.
- Select
Add Logpoint...from the context menu.
- In the dialog that appears, type the message you want to log.
- Click
OK.
The debugger will continue to run, and the message will be logged to the console at the specified line.
Inspecting Variables
You can inspect the value of variables in the current scope using the Variables panel.
- Set a breakpoint where you want to inspect a variable.
- Run your program in the debugger.
- When the debugger stops at the breakpoint, open the Variables panel.
- Click on the variable you want to inspect to expand it and see its value.
You can step through your code one line at a time using the Debug toolbar or keyboard shortcuts.
F10- Step over
Stepping through Code
F11- Step into
Shift+F11- Step out
Using the Debug Console
The Debug Console allows you to execute code in the context of your program.
- Open the Debug Console by clicking on the Console panel in the Debugger.
- Type the code you want to execute in the input field at the bottom of the panel.
- Press
Enterto execute the code.
Understanding the error message
- Read the error message: The error message will often give you a clue as to what went wrong in your code. Look for keywords or phrases that stand out, such as "undefined," "null," "unexpected token," or "type error."
- Look at the line number: The error message should also include the line number where the error occurred. This can help you pinpoint the specific area of your code that is causing the error.
- Check your syntax: Many JavaScript errors are caused by syntax errors, such as missing parentheses or semicolons. Double-check your code to make sure that you have used the correct syntax.
- Create a minimal reproducible example of the error. This means creating a small, self-contained piece of code that reproduces the error you are experiencing. This improves your understanding and makes it easier to share the problem with others to get help.